After breaking the psychological level at $30,000, the price of Bitcoin (BTC) has been moving in a sideways trend during the past week before returning below this important threshold, leaving investors to wonder in which direction the flagship decentralized finance (DeFi) asset could be moving next.
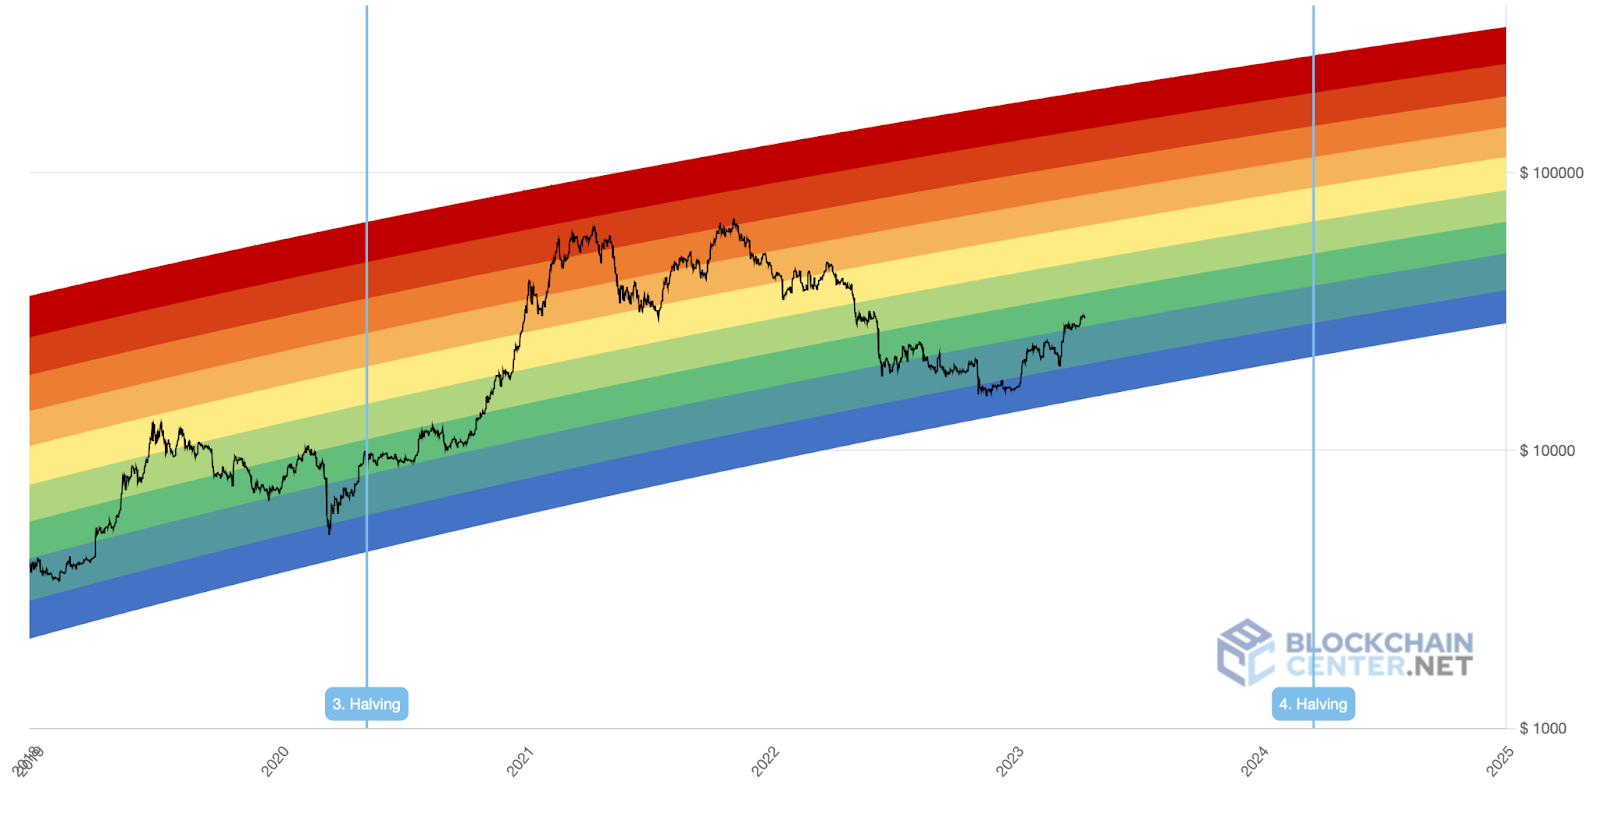
To help them identify potential trends in Bitcoin’s price movements, some of these cryptocurrency traders turn to BlockchainCenter’s rainbow price chart, which demonstrates the maiden digital asset’s historical movements in relation to various moving averages (MA).
As things stand, the rainbow chart suggests that Bitcoin is currently in the ‘Accumulate’ phase, which is indicated by the dark-green color. This phase presently stands in the Bitcoin price area between around $27,959 and $36,702, as per data retrieved on April 17.
End-of-year projections
In its most bullish scenario (dark red) for the end of 2023, the rainbow chart identifies the area between $180,311 and $245,016 as the ‘Maximum Bubble Territory’ for Bitcoin, as opposed to the most bearish scenario (dark blue) at $20,036 – $26,486, which is defined as ‘Basically a fire sale,’ on December 31, 2023.
Indeed, if Bitcoin’s rainbow chart is to follow earlier patterns, this means that it could end up in the ‘Maximum Bubble Territory’ by the end of the year, taking into account that the same thing happened in 2017 when BTC rose from the ‘Accumulate’ phase in May to the ‘Maximum Bubble Territory’ in December.
Bullish summer?
As for the early summer of 2023, the chart projects a range between $151,924.74 and $207,035.58 for Bitcoin, to which it refers as the ‘Maximum Bubble Territory.’ The most bearish scenario expects Bitcoin to trade between $16,443 and $21,807 on June 21, 2023, calling it ‘Basically a fire sale.’
In 2020, the ‘Accumulate’ phase was slightly longer, lasting from May to October, and Bitcoin failed to climb to the maximum. However, it came fairly close – in the ‘Sell. Seriously. Sell!’ area within only four months – in February 2021 and staying there, interchangeably with the ‘FOMO intensifies’ phase, until August, indicating that summer 2023 could be decisive for Bitcoin as it could reach $114,957 – $151,925.
Bitcoin price analysis
At press time, Bitcoin was trading at the price of $29,904, recording a decrease of 1.37% on the day but still holding on to the gains of 5.47% across the previous week and of 8.87% in the last 30 days, whereas it has gained nearly 80% on its year-to-date (YTD) chart.
Whether Bitcoin truly manages to climb to the area above $100,000 by the end of 2023 (or sooner) will depend on many factors, including the general atmosphere in the crypto industry, which itself is under the influence of developments like the regulatory attitude towards it, as well as the outcome of the important lawsuits in the sector.
Disclaimer: The content on this site should not be considered investment advice. Investing is speculative. When investing, your capital is at risk.


Leave a Reply